This function visualizes the straight skeleton derived from a given polygon. The original polygon (with holes if present) is plotted in black, while the straight skeleton is plotted in red.
Arguments
- skeleton
A list object of class 'rayskeleton' containing the straight skeleton details. It should have 'nodes' and 'links' as its primary components.
- use_arrow
Default `TRUE`. A logical value indicating whether or not to use arrows to represent the links of the straight skeleton. Default is TRUE.
- use_points
Default `TRUE`. Whether to plot the vertex points as well.
- xlim
Default`c(0,1)`. A numeric vector of length 2 specifying the x-limits of the plot in the form `c(min, max)`. These are proportional limits relative to the bounding box around the skeleton.
- ylim
Default `c(0,1)`. A numeric vector of length 2 specifying the y-limits of the plot in the form c(min, max). These are proportional limits relative to the bounding box around the skeleton.
- arrow_color
Default `"red"`. Color of the arrows.
- polygon_color
Default `"black"`. Color of the polygon.
- size
Default `1`. Size of the vertex points.
- arrow_size
Default `1`. Scales the arrow size.
- highlight_links
Default `NULL`. A numeric vector indicating which links (by their index) to highlight. If specified, the corresponding links will be colored with the `highlight_color`.
- highlight_color
Default `"purple"`. Color of the highlighted links.
- return_layers
Default `FALSE`, plots the figure. If `TRUE`, this will instead return a list of the ggplot layers.
Details
The function uses the `ggplot2` package for plotting. The straight skeleton is visualized based on the details provided in the `skeleton` object. The original polygon and holes are plotted based on attributes stored in the `skeleton` object.
Examples
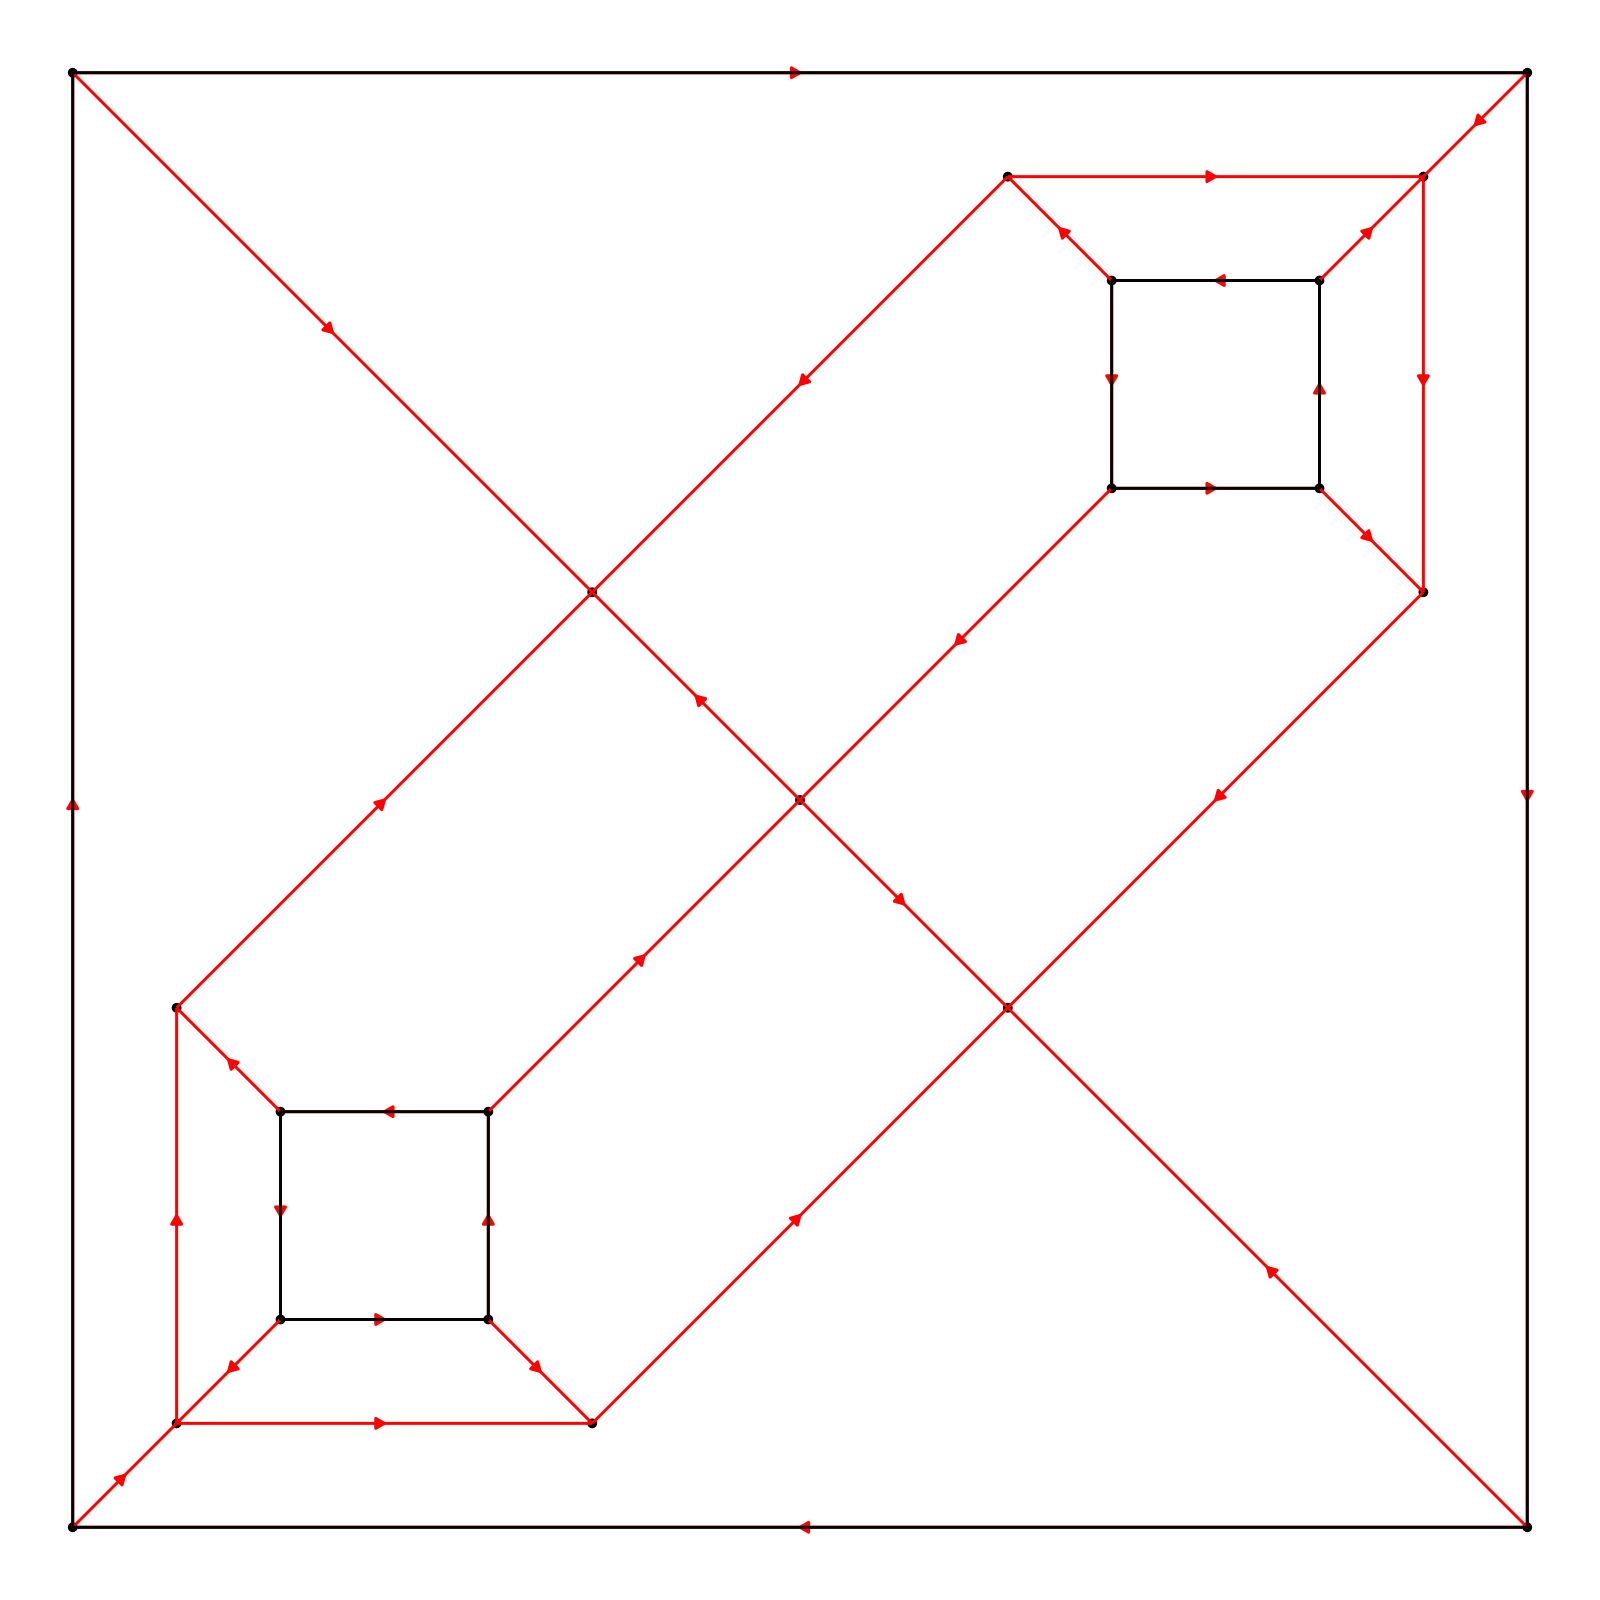
# Assuming skeleton1 is already defined as in the previous example
# Outer polygon
vertices = matrix(c(0,0, 7,0, 7,7, 0,7, 0,0), ncol = 2, byrow = TRUE)
# Holes inside the polygon
hole1 = matrix(c(1,1, 1,2, 2,2, 2,1, 1,1), ncol = 2, byrow = TRUE)
hole2 = matrix(c(5,5, 5,6, 6,6, 6,5, 5,5), ncol = 2, byrow = TRUE)
skeleton = skeletonize(vertices, holes = list(hole1, hole2))
if(run_docs_raybevel()) {
plot_skeleton(skeleton)
}
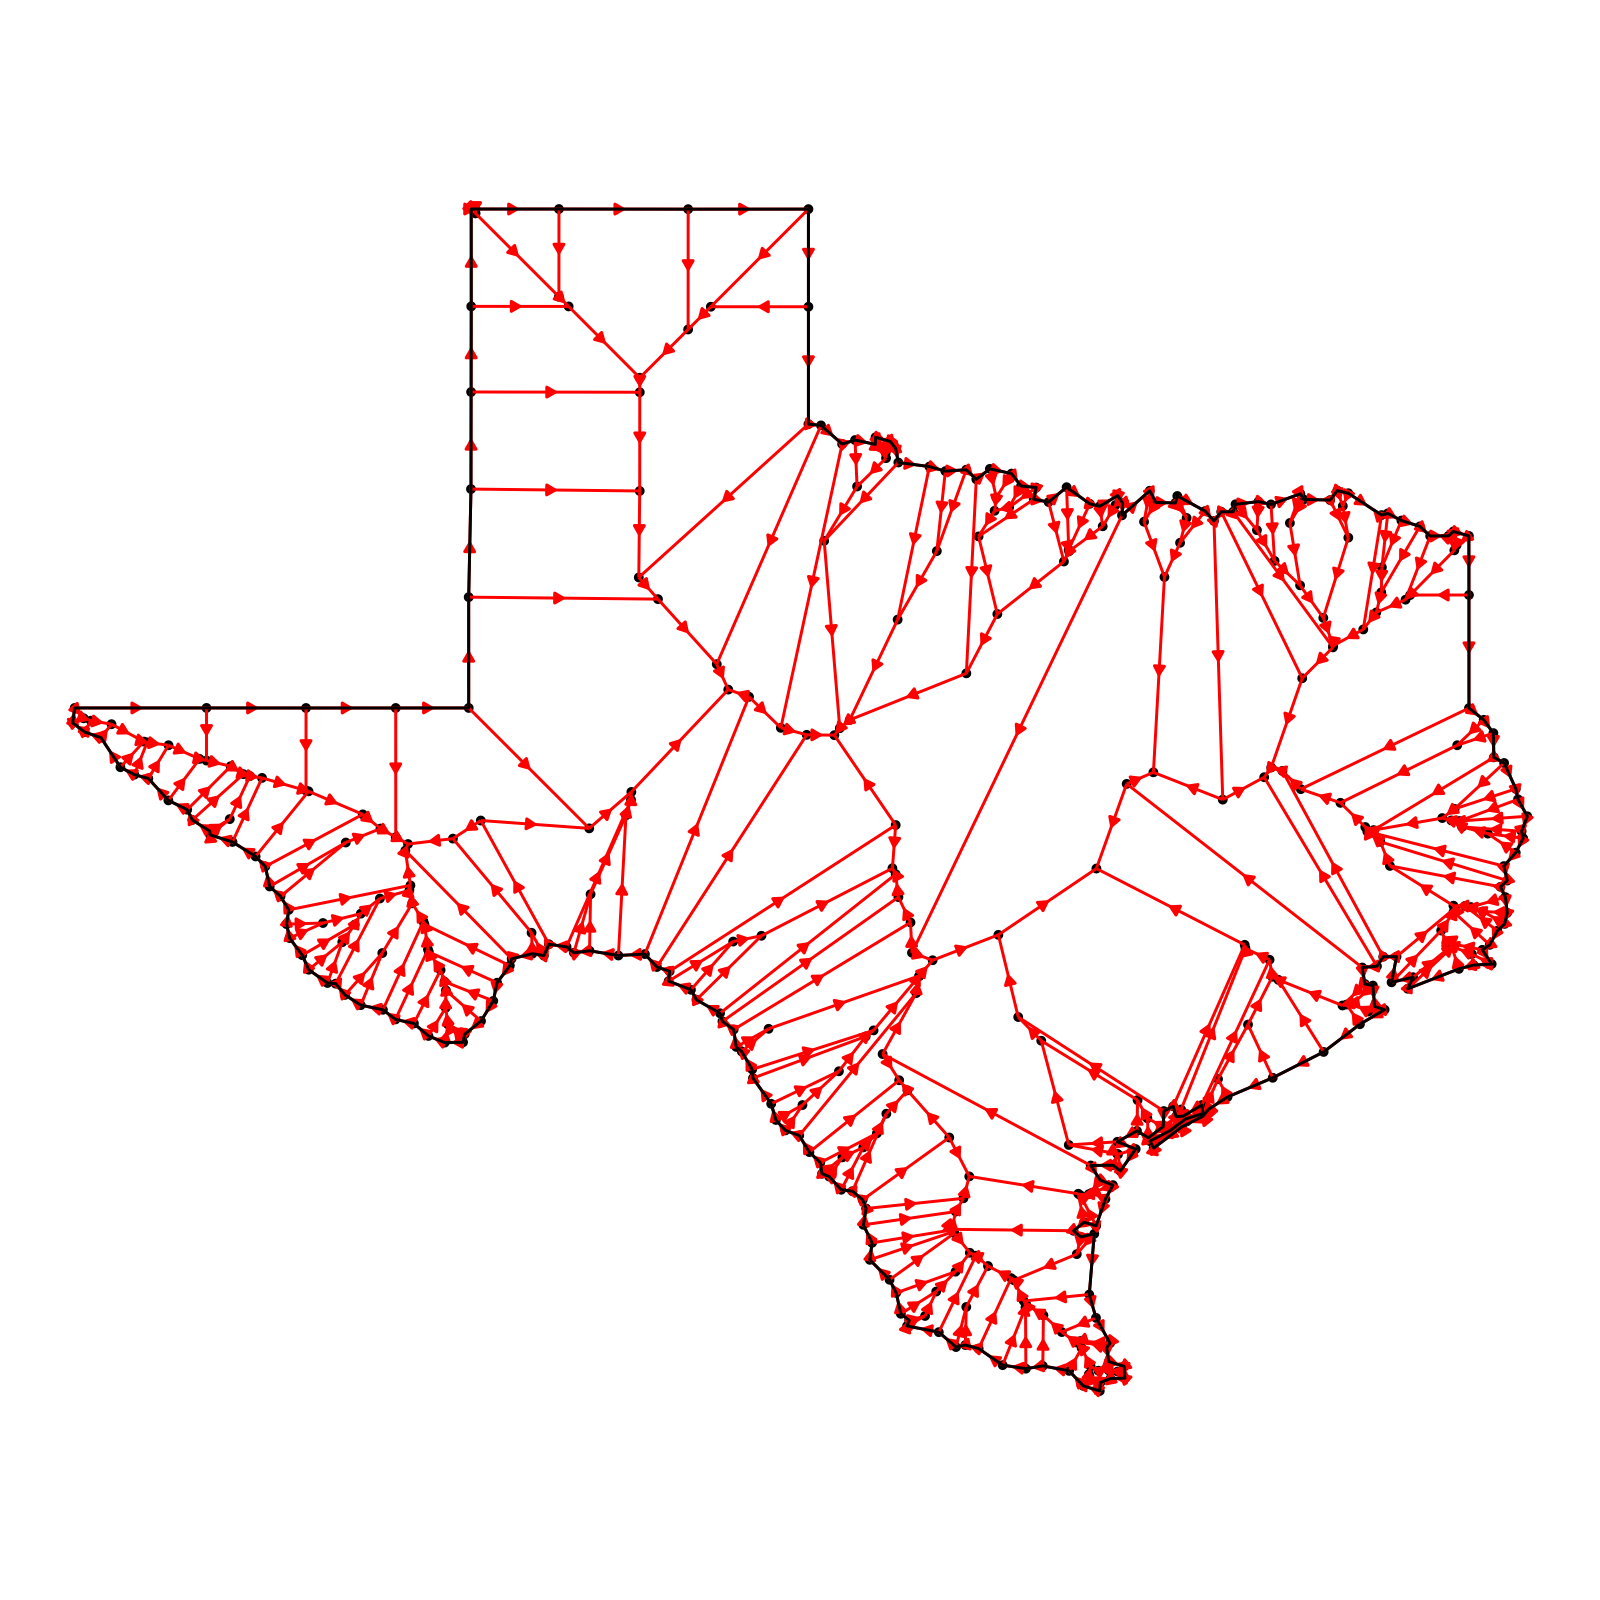
 # Skeletonize and plot an {sf} object
if(run_docs_raybevel()) {
us_states = spData::us_states
texas = us_states[us_states$NAME == "Texas",]
plot_skeleton(skeletonize(texas))
}
# Skeletonize and plot an {sf} object
if(run_docs_raybevel()) {
us_states = spData::us_states
texas = us_states[us_states$NAME == "Texas",]
plot_skeleton(skeletonize(texas))
}
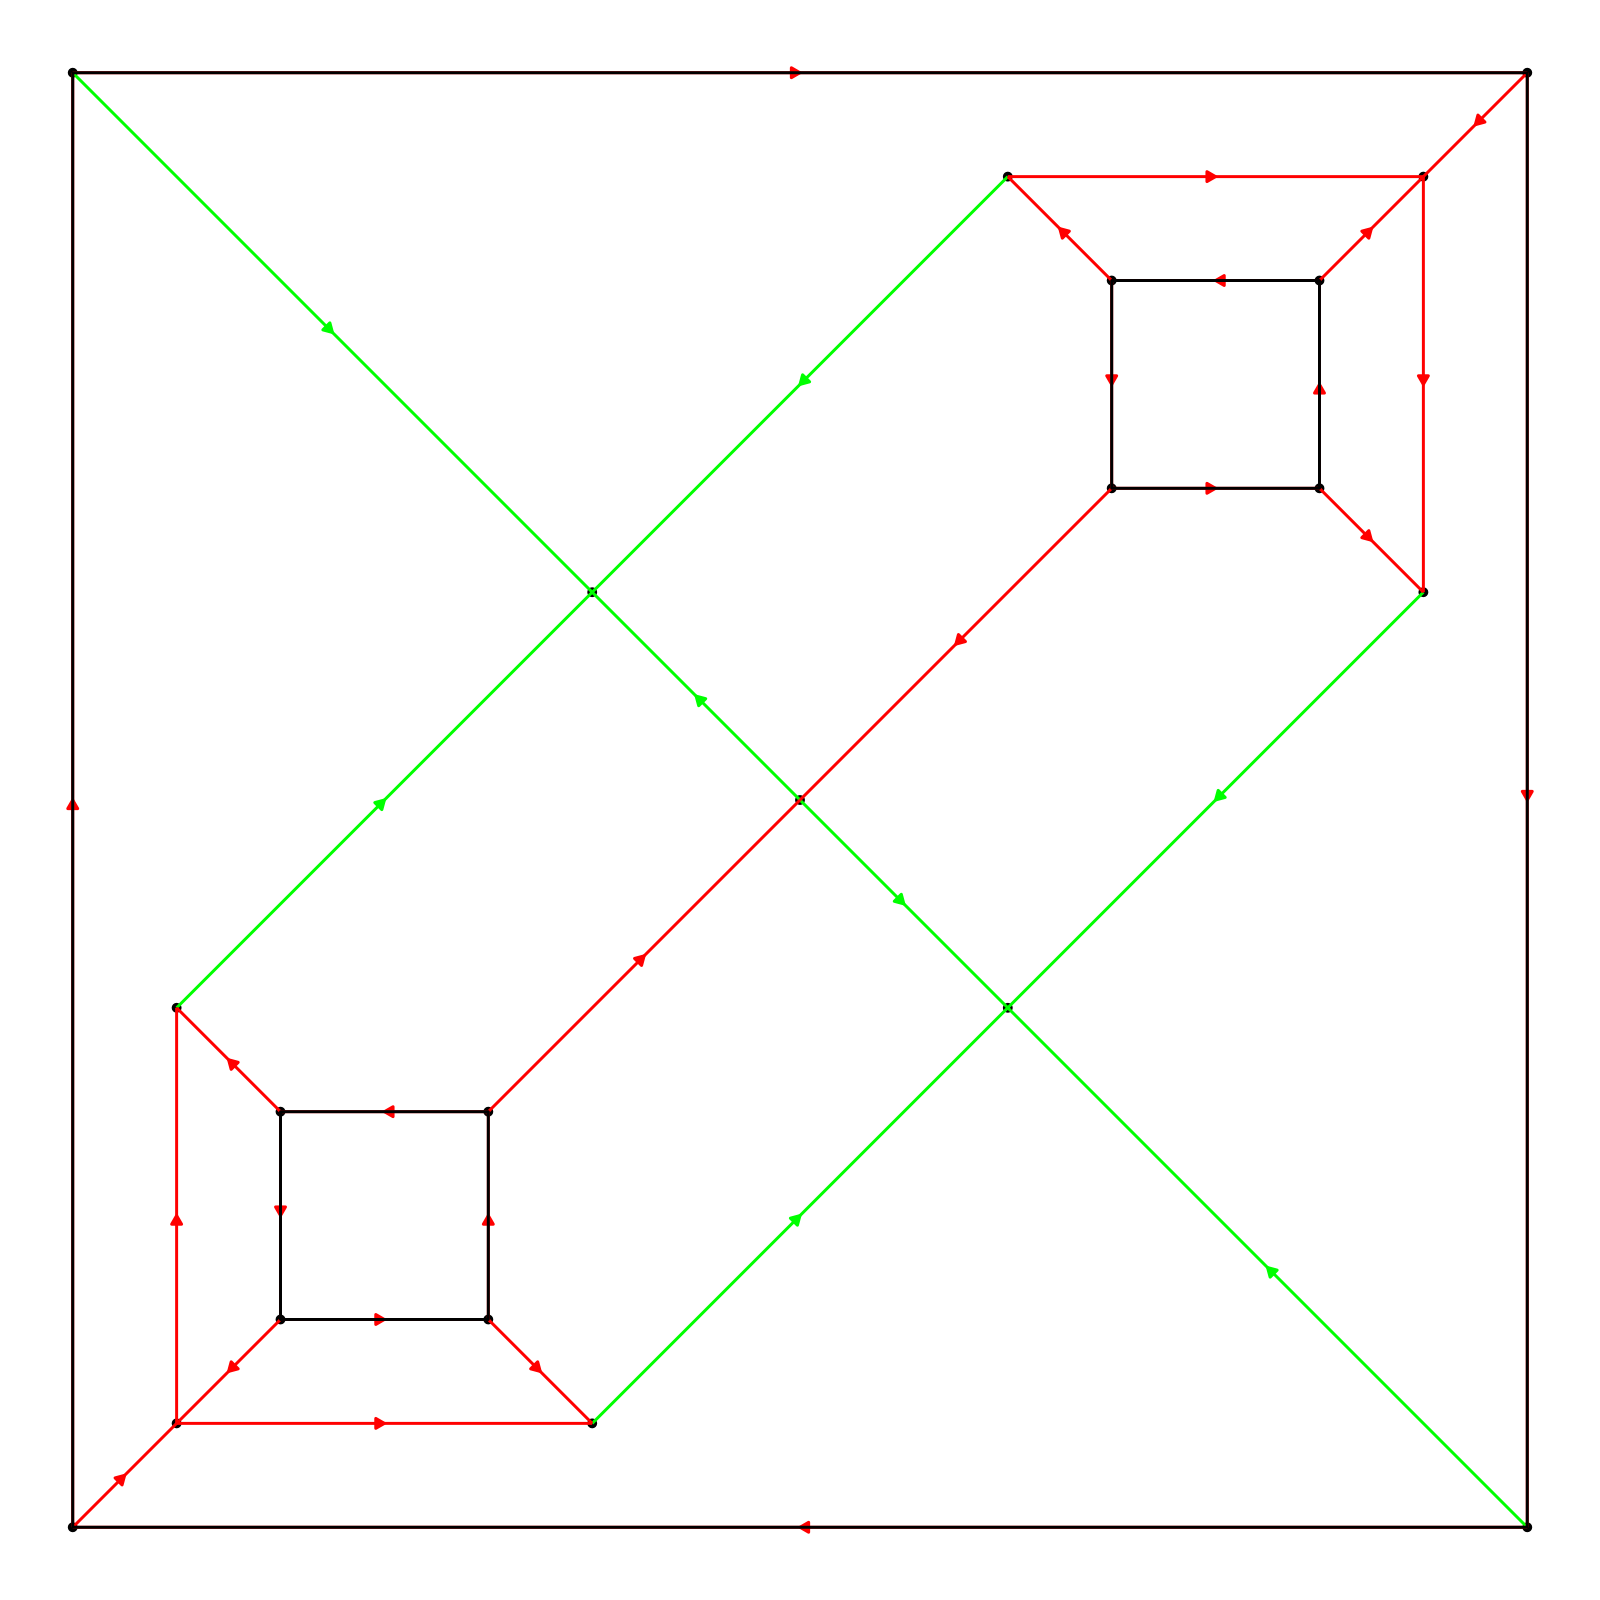
 # Highlighting certain links in the skeleton
max_links =which(skeleton$links$destination_time == max(skeleton$links$destination_time))
if(run_docs_raybevel()) {
plot_skeleton(skeleton, highlight_links = max_links, highlight_color = "green")
}
# Highlighting certain links in the skeleton
max_links =which(skeleton$links$destination_time == max(skeleton$links$destination_time))
if(run_docs_raybevel()) {
plot_skeleton(skeleton, highlight_links = max_links, highlight_color = "green")
}